Kota Widgets
Last updated: September 10, 2026
When Kota answers a question with a chart, you can keep that chart. Save it to an Analytics dashboard and it becomes a permanent tile that re-runs its query every time the dashboard loads — so the numbers are current each time you or your team look, not frozen at the moment you asked.
Before you start
This is available to everyone in your organization by default, and it sits alongside Hyperbound's built-in analytics tiles on the same dashboards. Your Hyperbound admin can turn it off for your organization, so if you don't see the buttons described below, ask your admin whether it's switched on.
You'll need a Kota chat answer that contains a chart, and somewhere to put it — an existing Analytics dashboard, or a new one you create as you go.
Create one from a Kota answer
There are two places to start, and both end at the same setup form.
1. Find the chart you want to keep
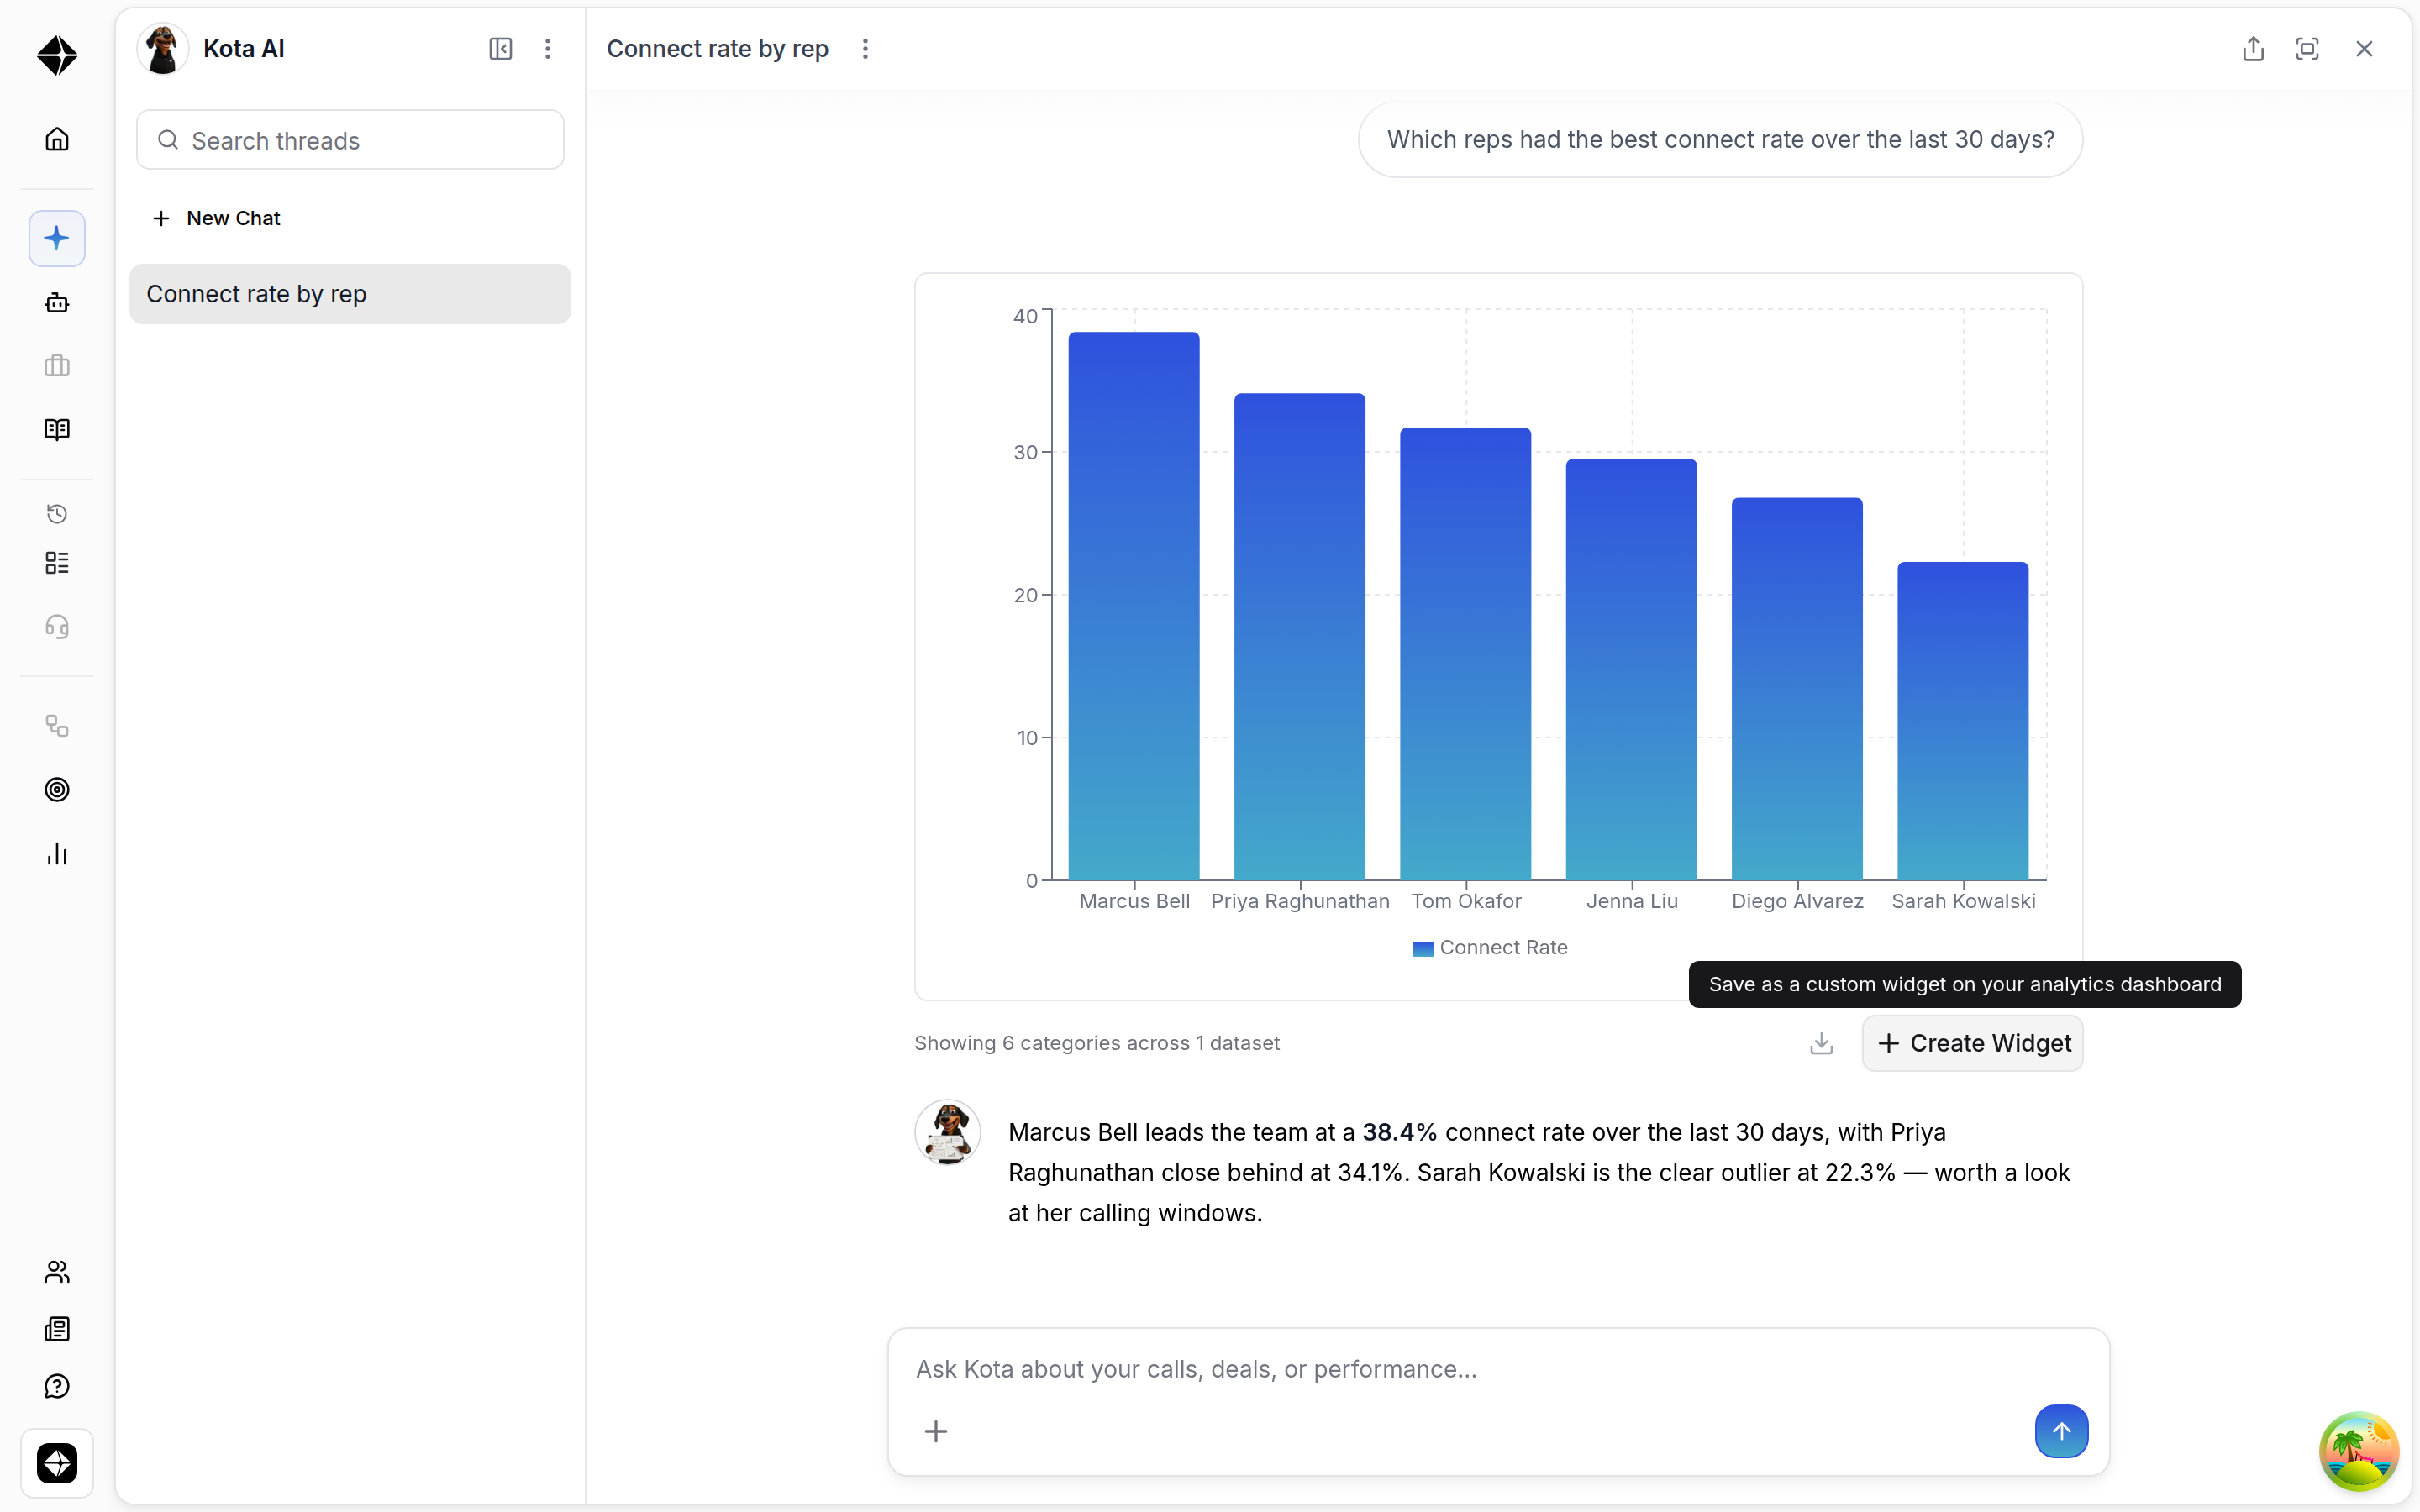
Ask Kota your question in chat as usual. Every table, bar chart, line chart and pie chart in Kota's answer has a row of actions underneath it, including Create Widget — hover it and you'll see “Save as a custom widget on your analytics dashboard.”
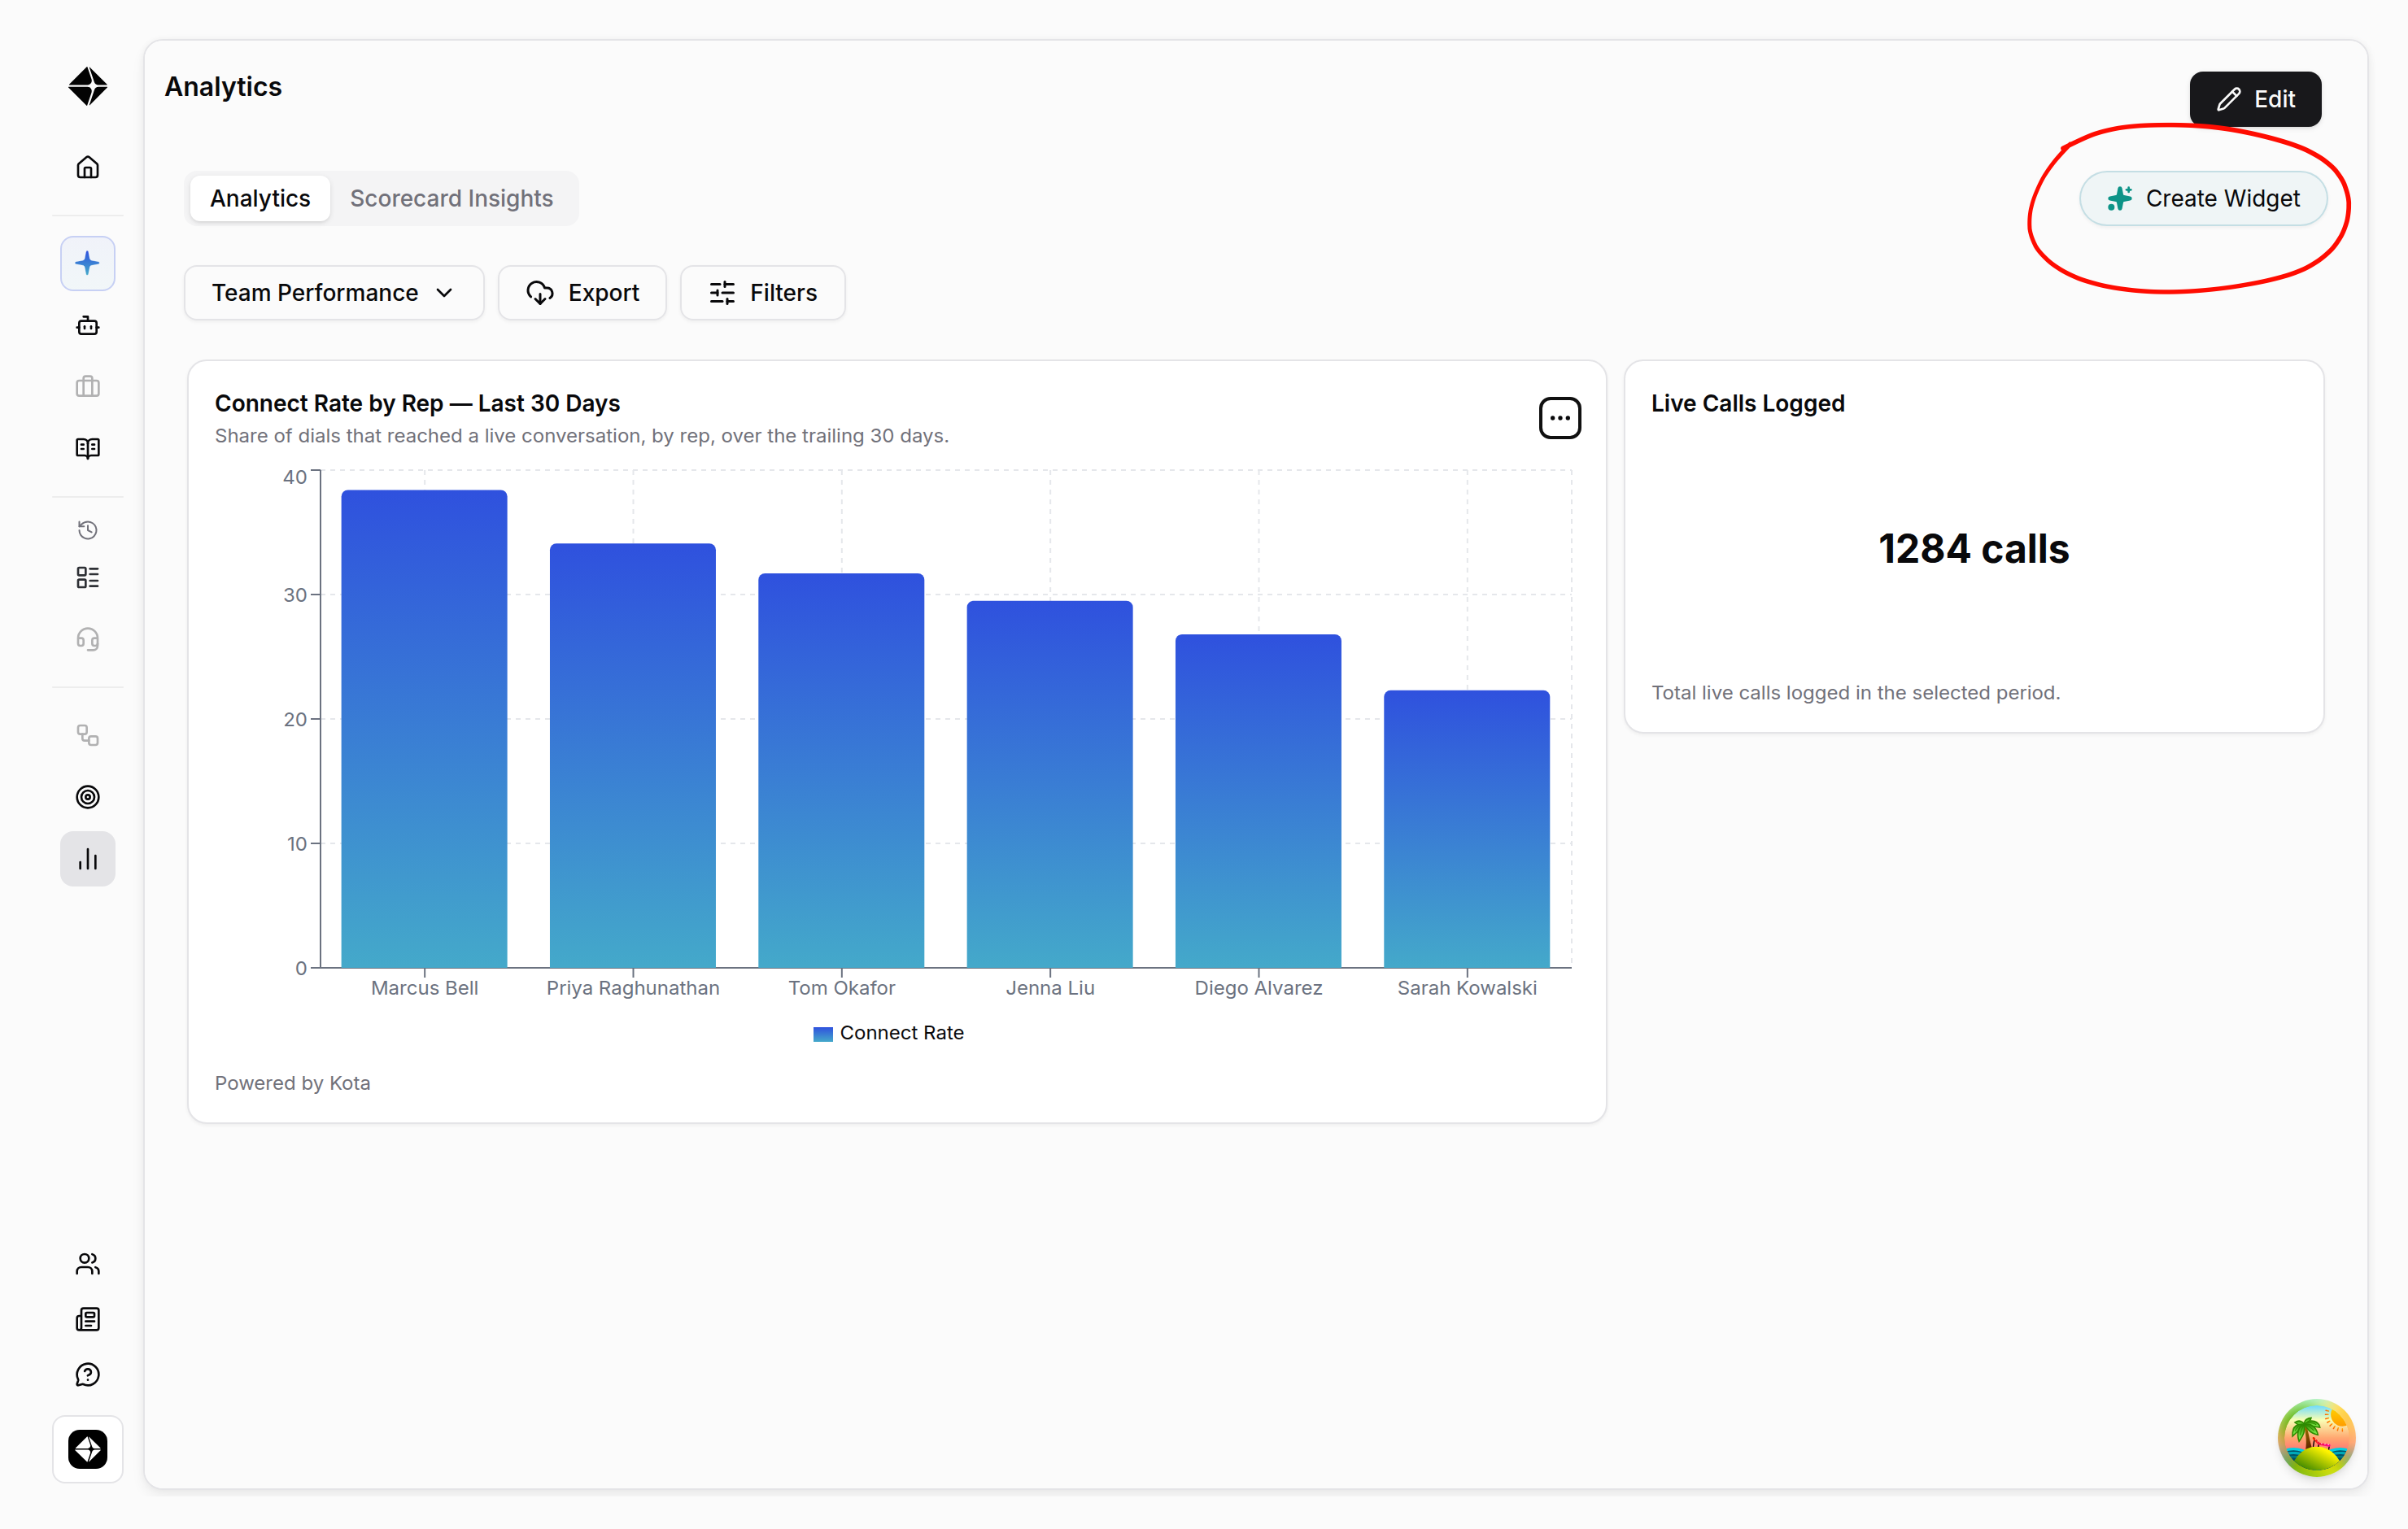
If you were already looking at a dashboard, you can start from the other end instead: the Create Widget button in the Analytics header opens a new Kota chat pointed at that dashboard, so it's pre-selected when you save.
2. Open the setup form
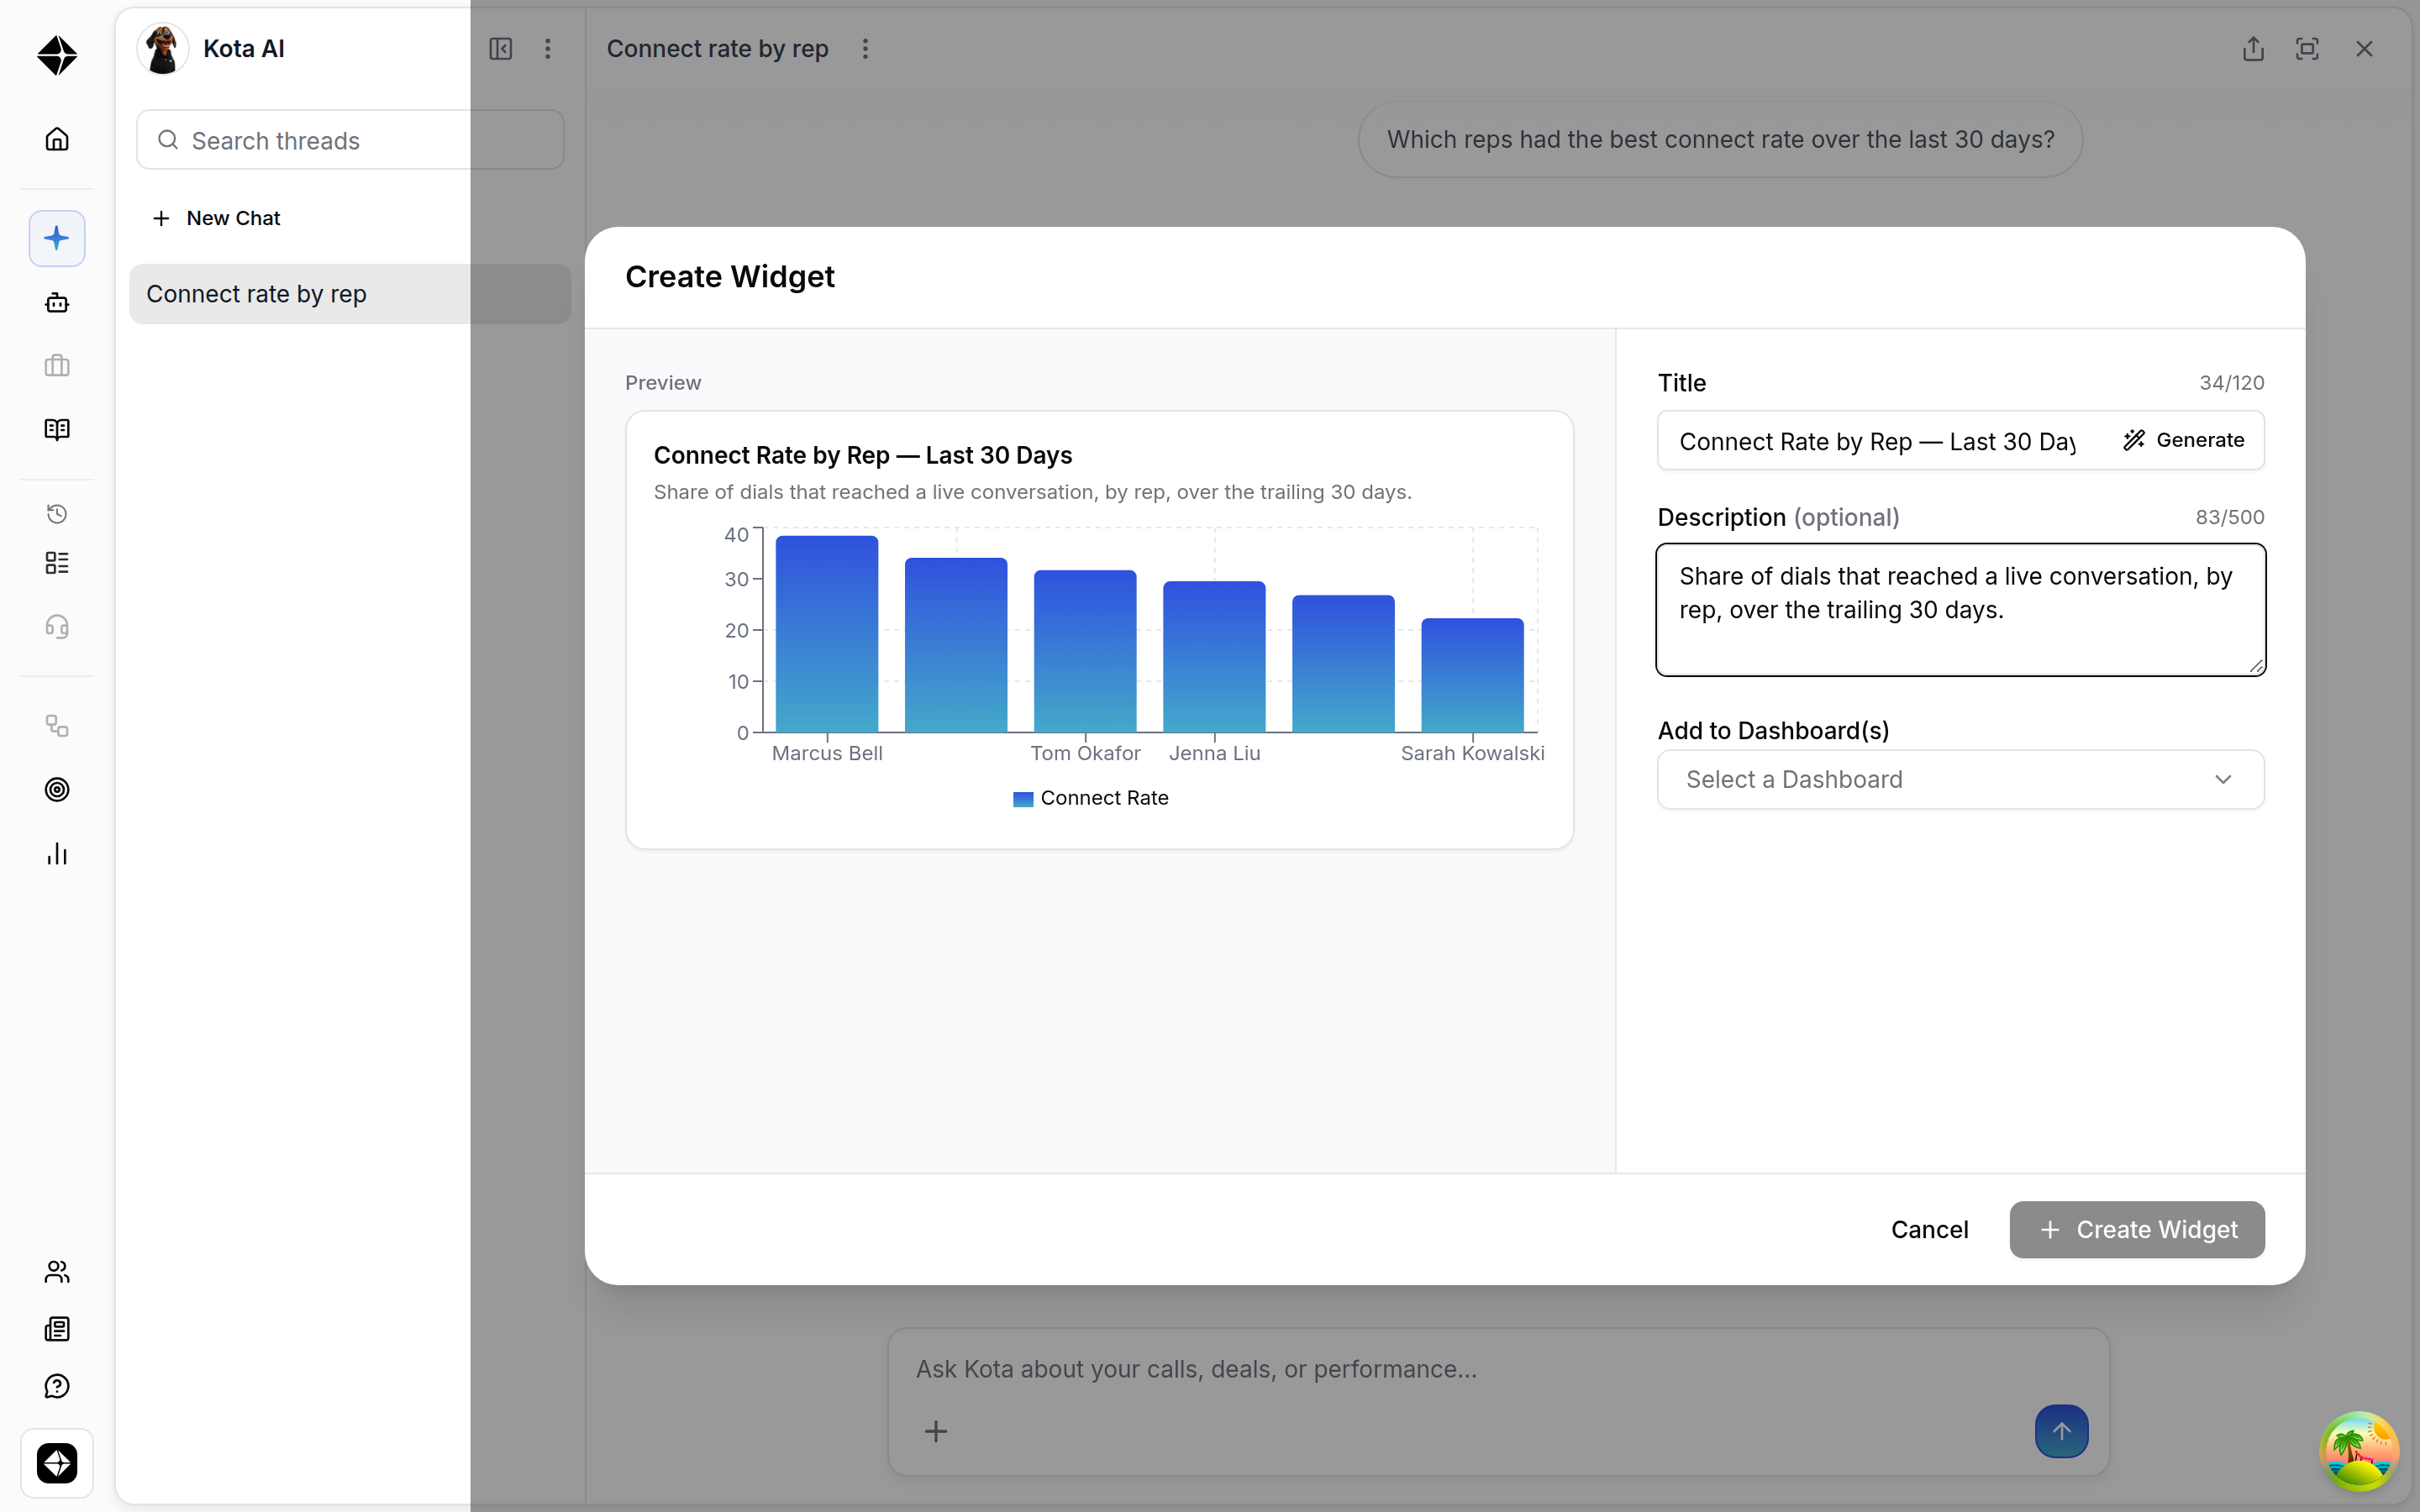
Selecting Create Widget opens a panel next to the chat. The left side is a live preview of exactly how the tile will look on a dashboard; the right side is where you fill in the details. The preview updates as you type.
3. Give it a title and, if you like, a description
Hyperbound writes a title for you as soon as the form opens. You can replace it, or use Generate to write a fresh one — generating never overwrites anything you've typed yourself.
Title is required, up to 120 characters, with a counter as you type.
Description is optional, up to 500 characters, and appears under the title on the dashboard.
Write the title for someone who wasn't in your chat: Objection-handling score by rep, last 30 days tells a manager scanning a dashboard far more than Kota chart.
4. Choose the dashboards, then save
Pick at least one dashboard under Add to Dashboard(s). The button at the bottom stays unavailable until you have both a title and one dashboard selected.
Select Create Widget to save. You'll get “Widget created successfully!” with a View Dashboard shortcut to jump straight to it.
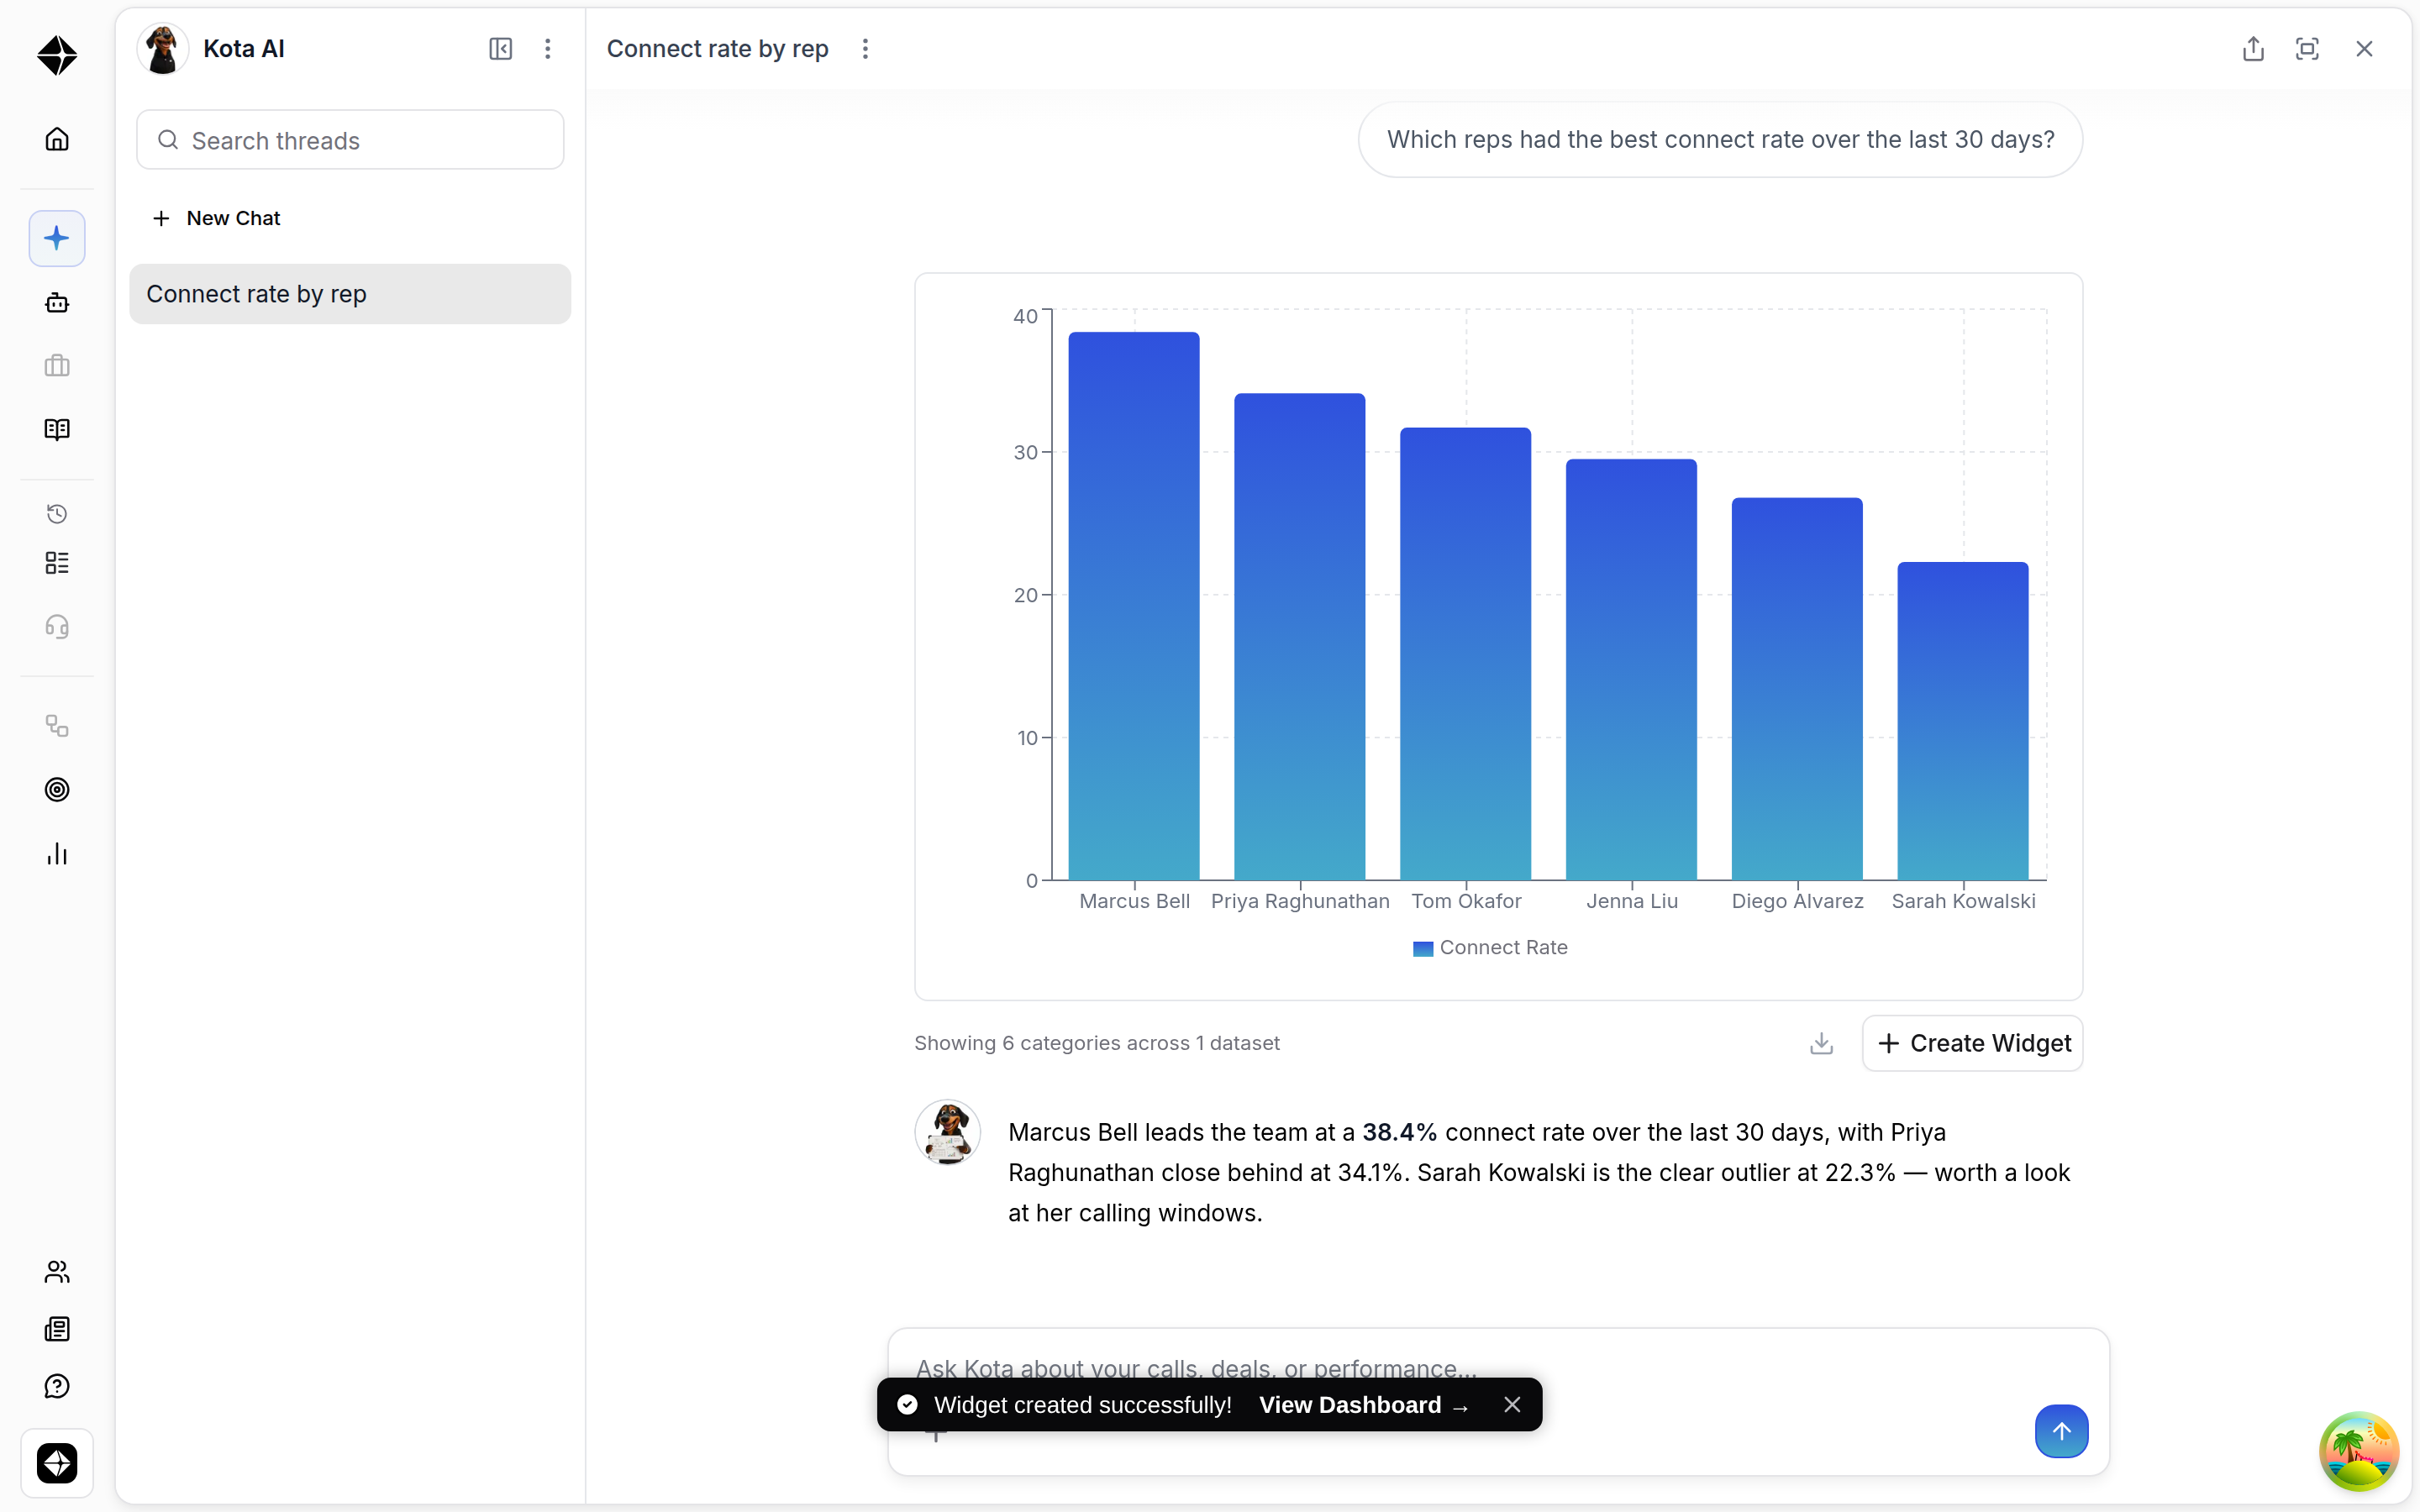
Chart type: You don't choose between table, bar, line and pie — the tile keeps whatever Kota drew in the answer. If you want a different shape, ask Kota to redraw it in chat and save from that chart instead.
Choose where it lives
Add to Dashboard(s) is a multi-select. Each dashboard you pick appears as a chip you can remove. Inside the picker there's a search box, a checkbox list of your dashboards, and Create New Dashboard.
Selecting several dashboards at once puts the same tile on each of them — useful when one chart belongs on both a team dashboard and your own.
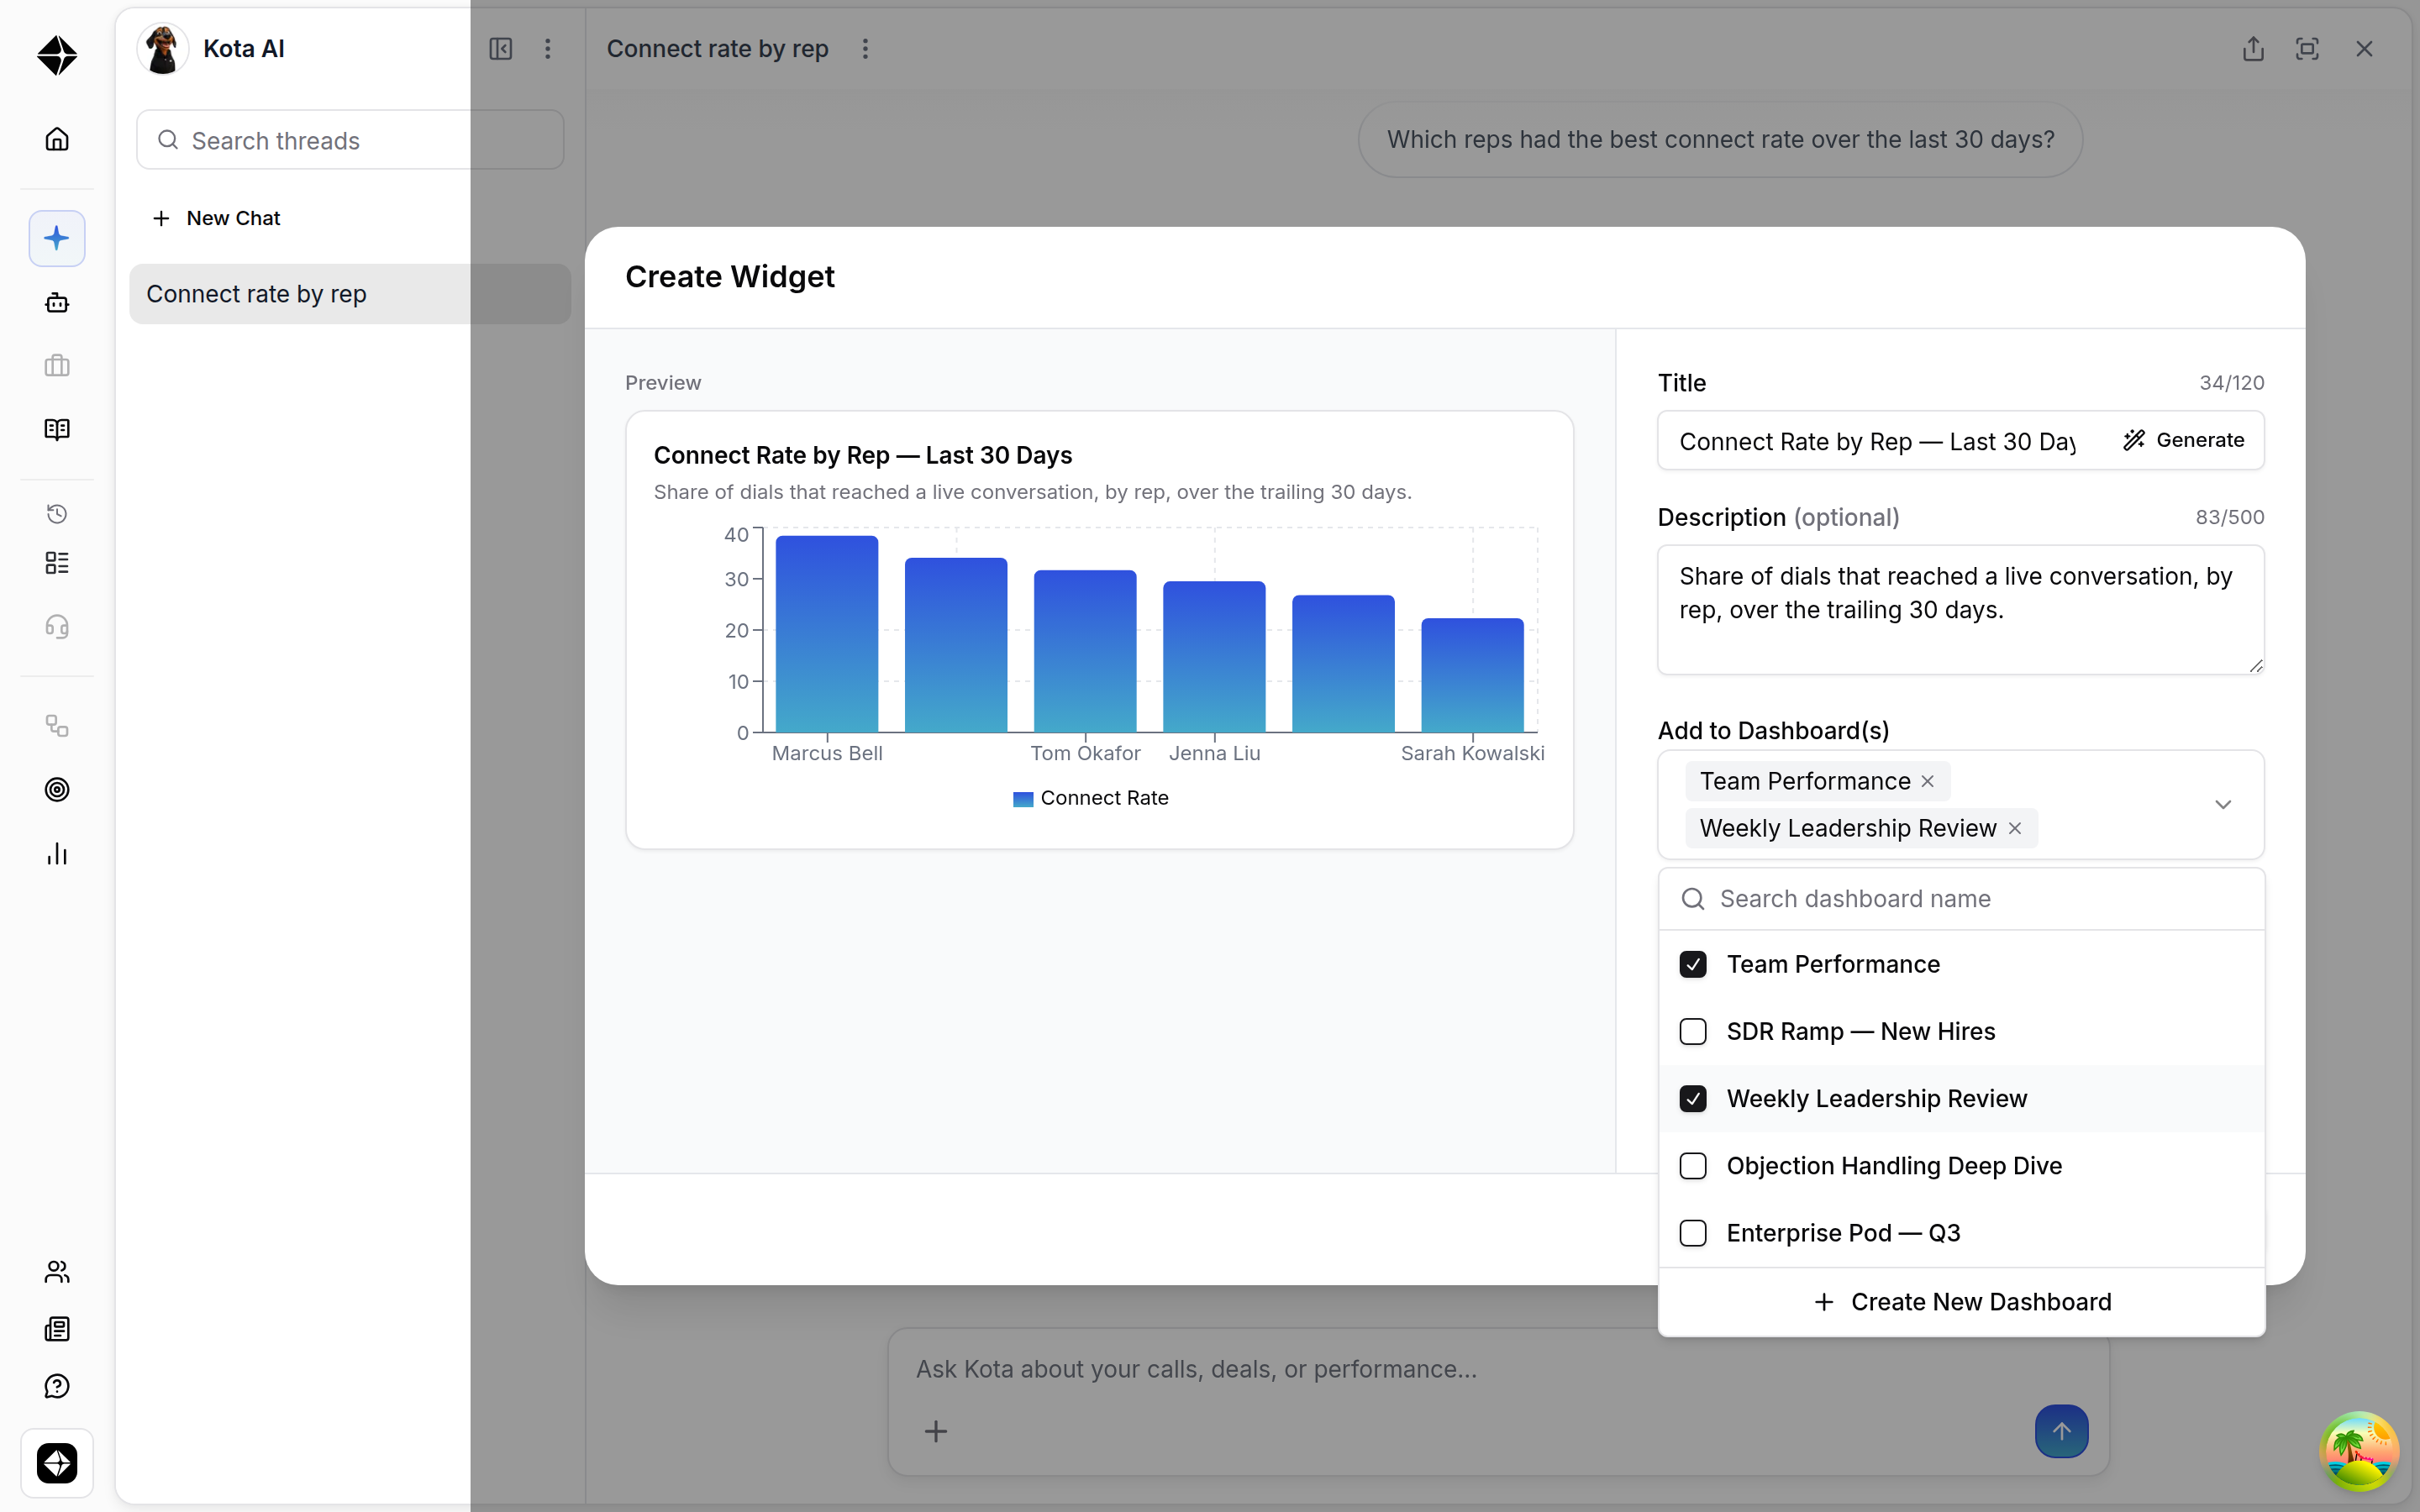
Creating a dashboard as you go
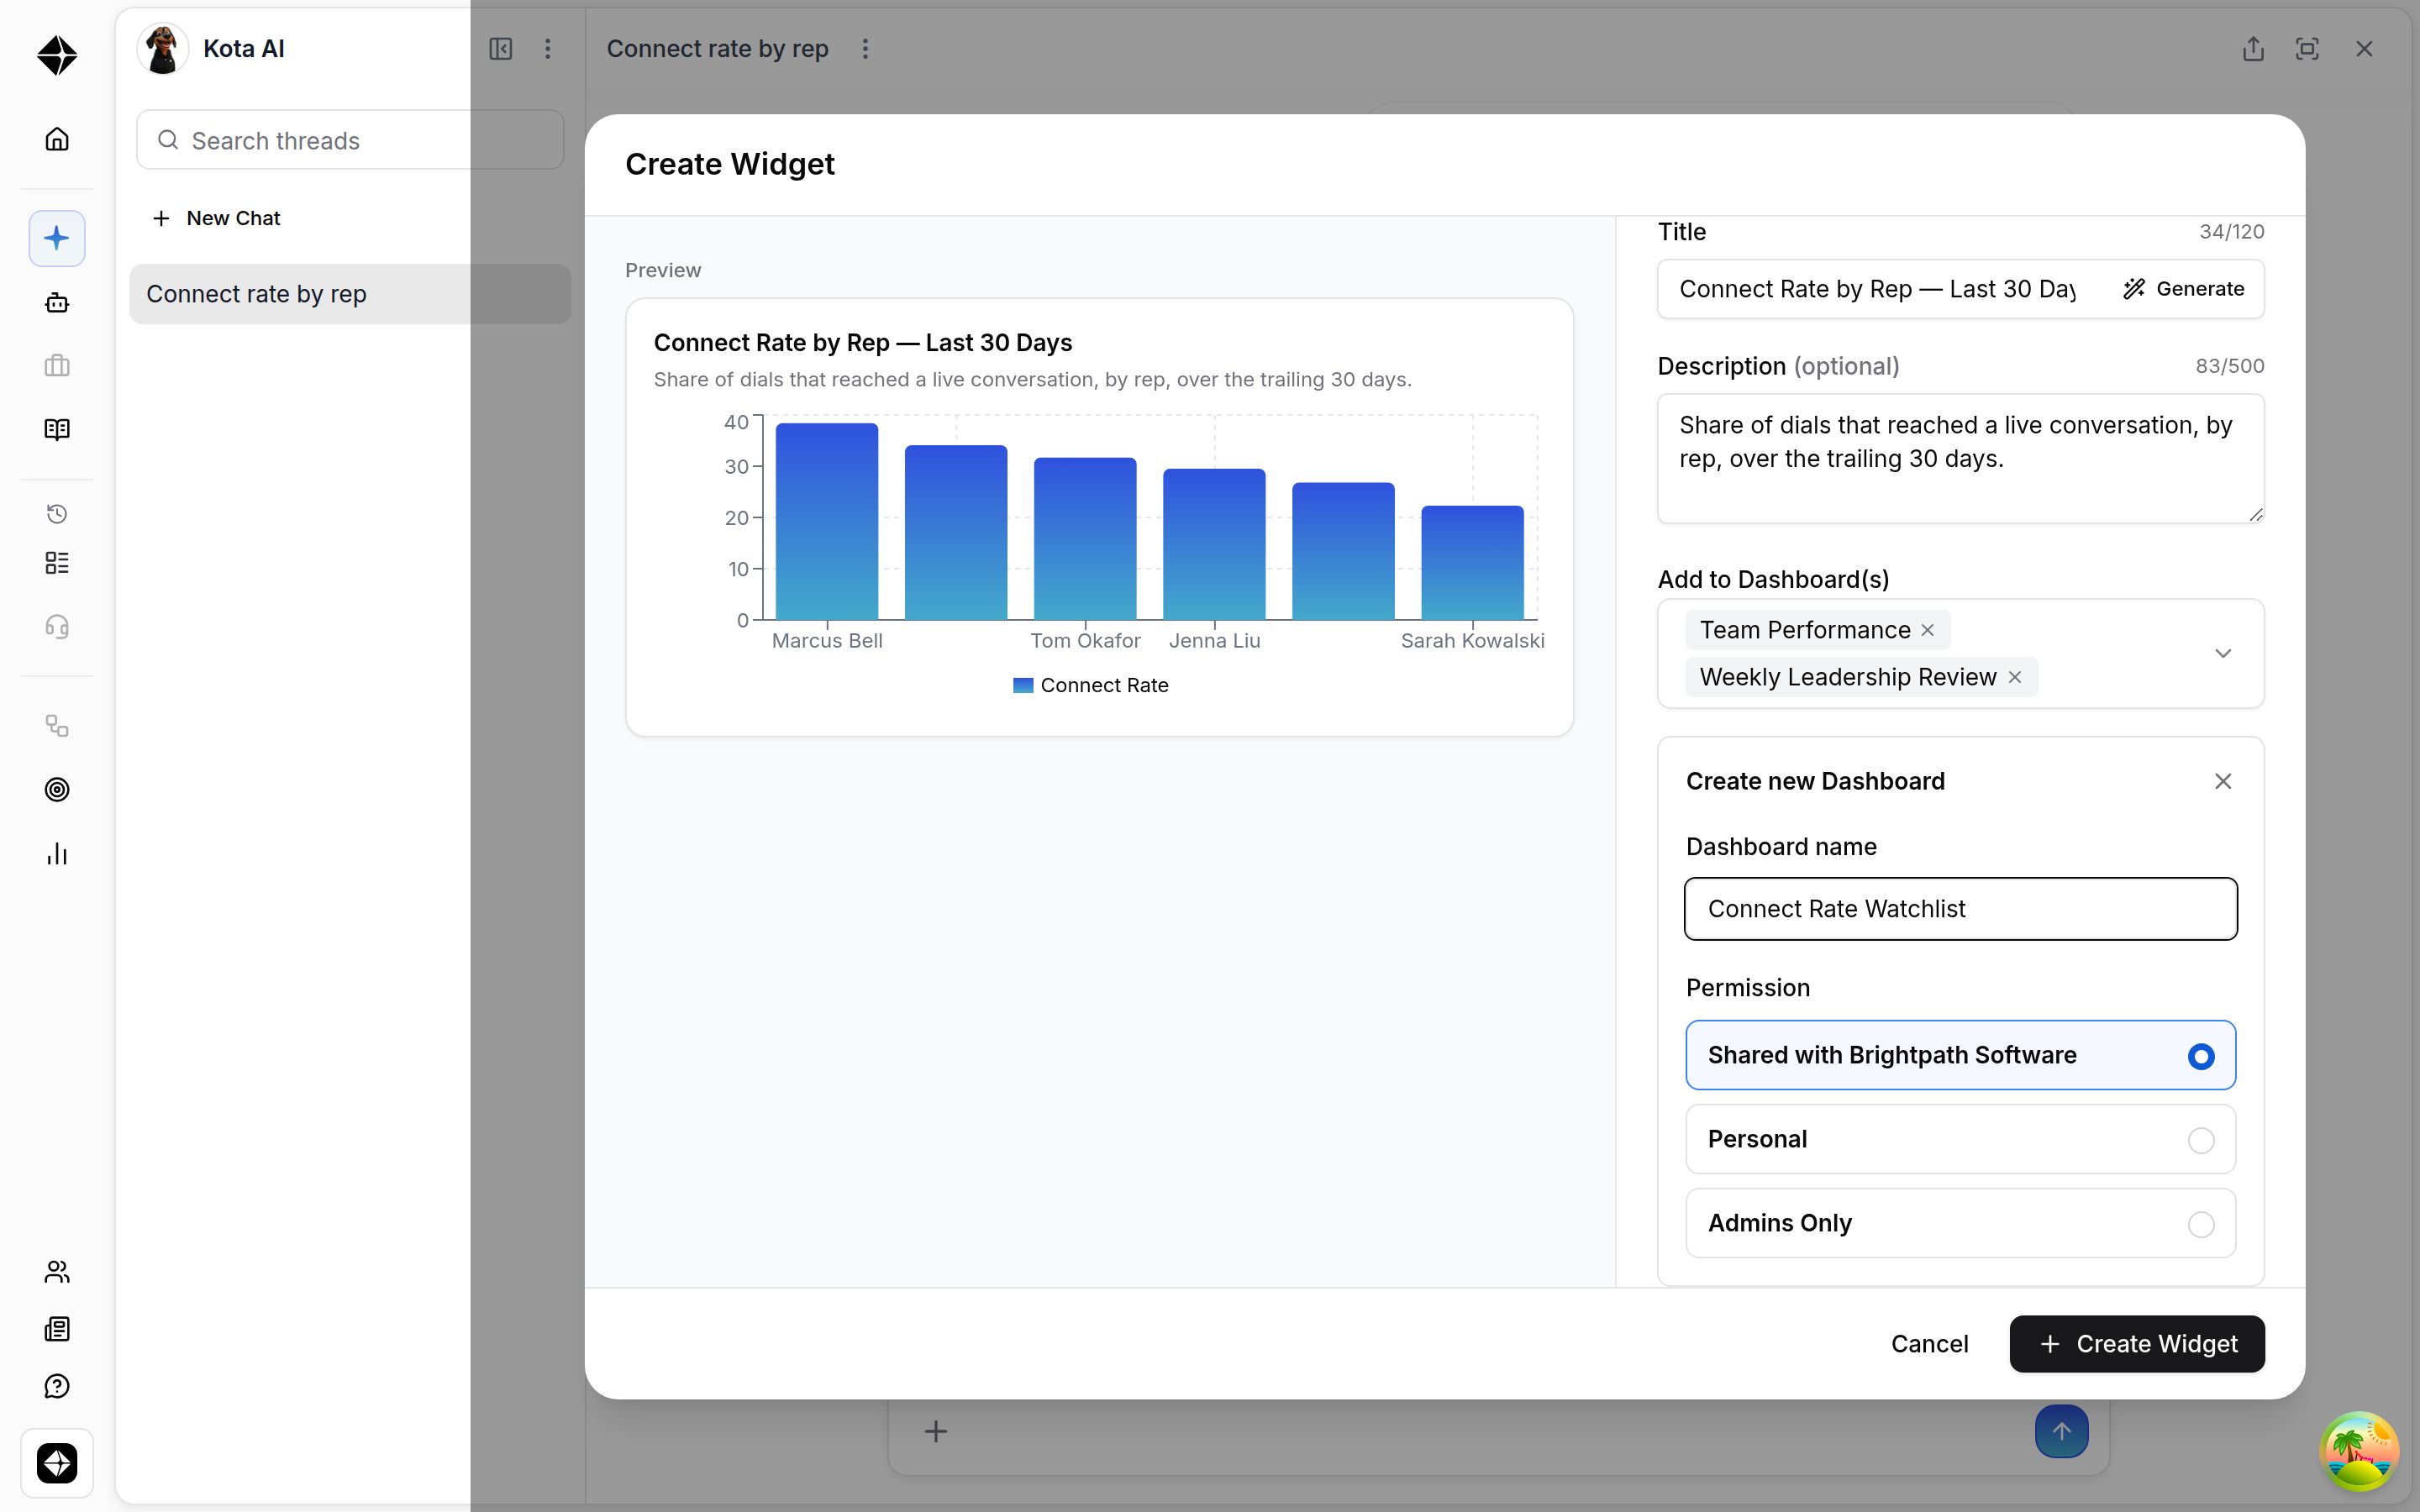
Create New Dashboard asks for a name and a permission level. There are three, and the one you choose decides who can see everything on that dashboard:
Shared with your organization — Everyone in your Hyperbound organization can see the dashboard.
Personal — Only you.
Admins Only — Only administrators of your organization.
Manage it on your dashboard
On the dashboard, the tile shows its title, the description underneath, the chart itself, and a Powered by Kota label in the footer. It arrives at a sensible default size and you can resize and move it exactly like Hyperbound's built-in tiles.
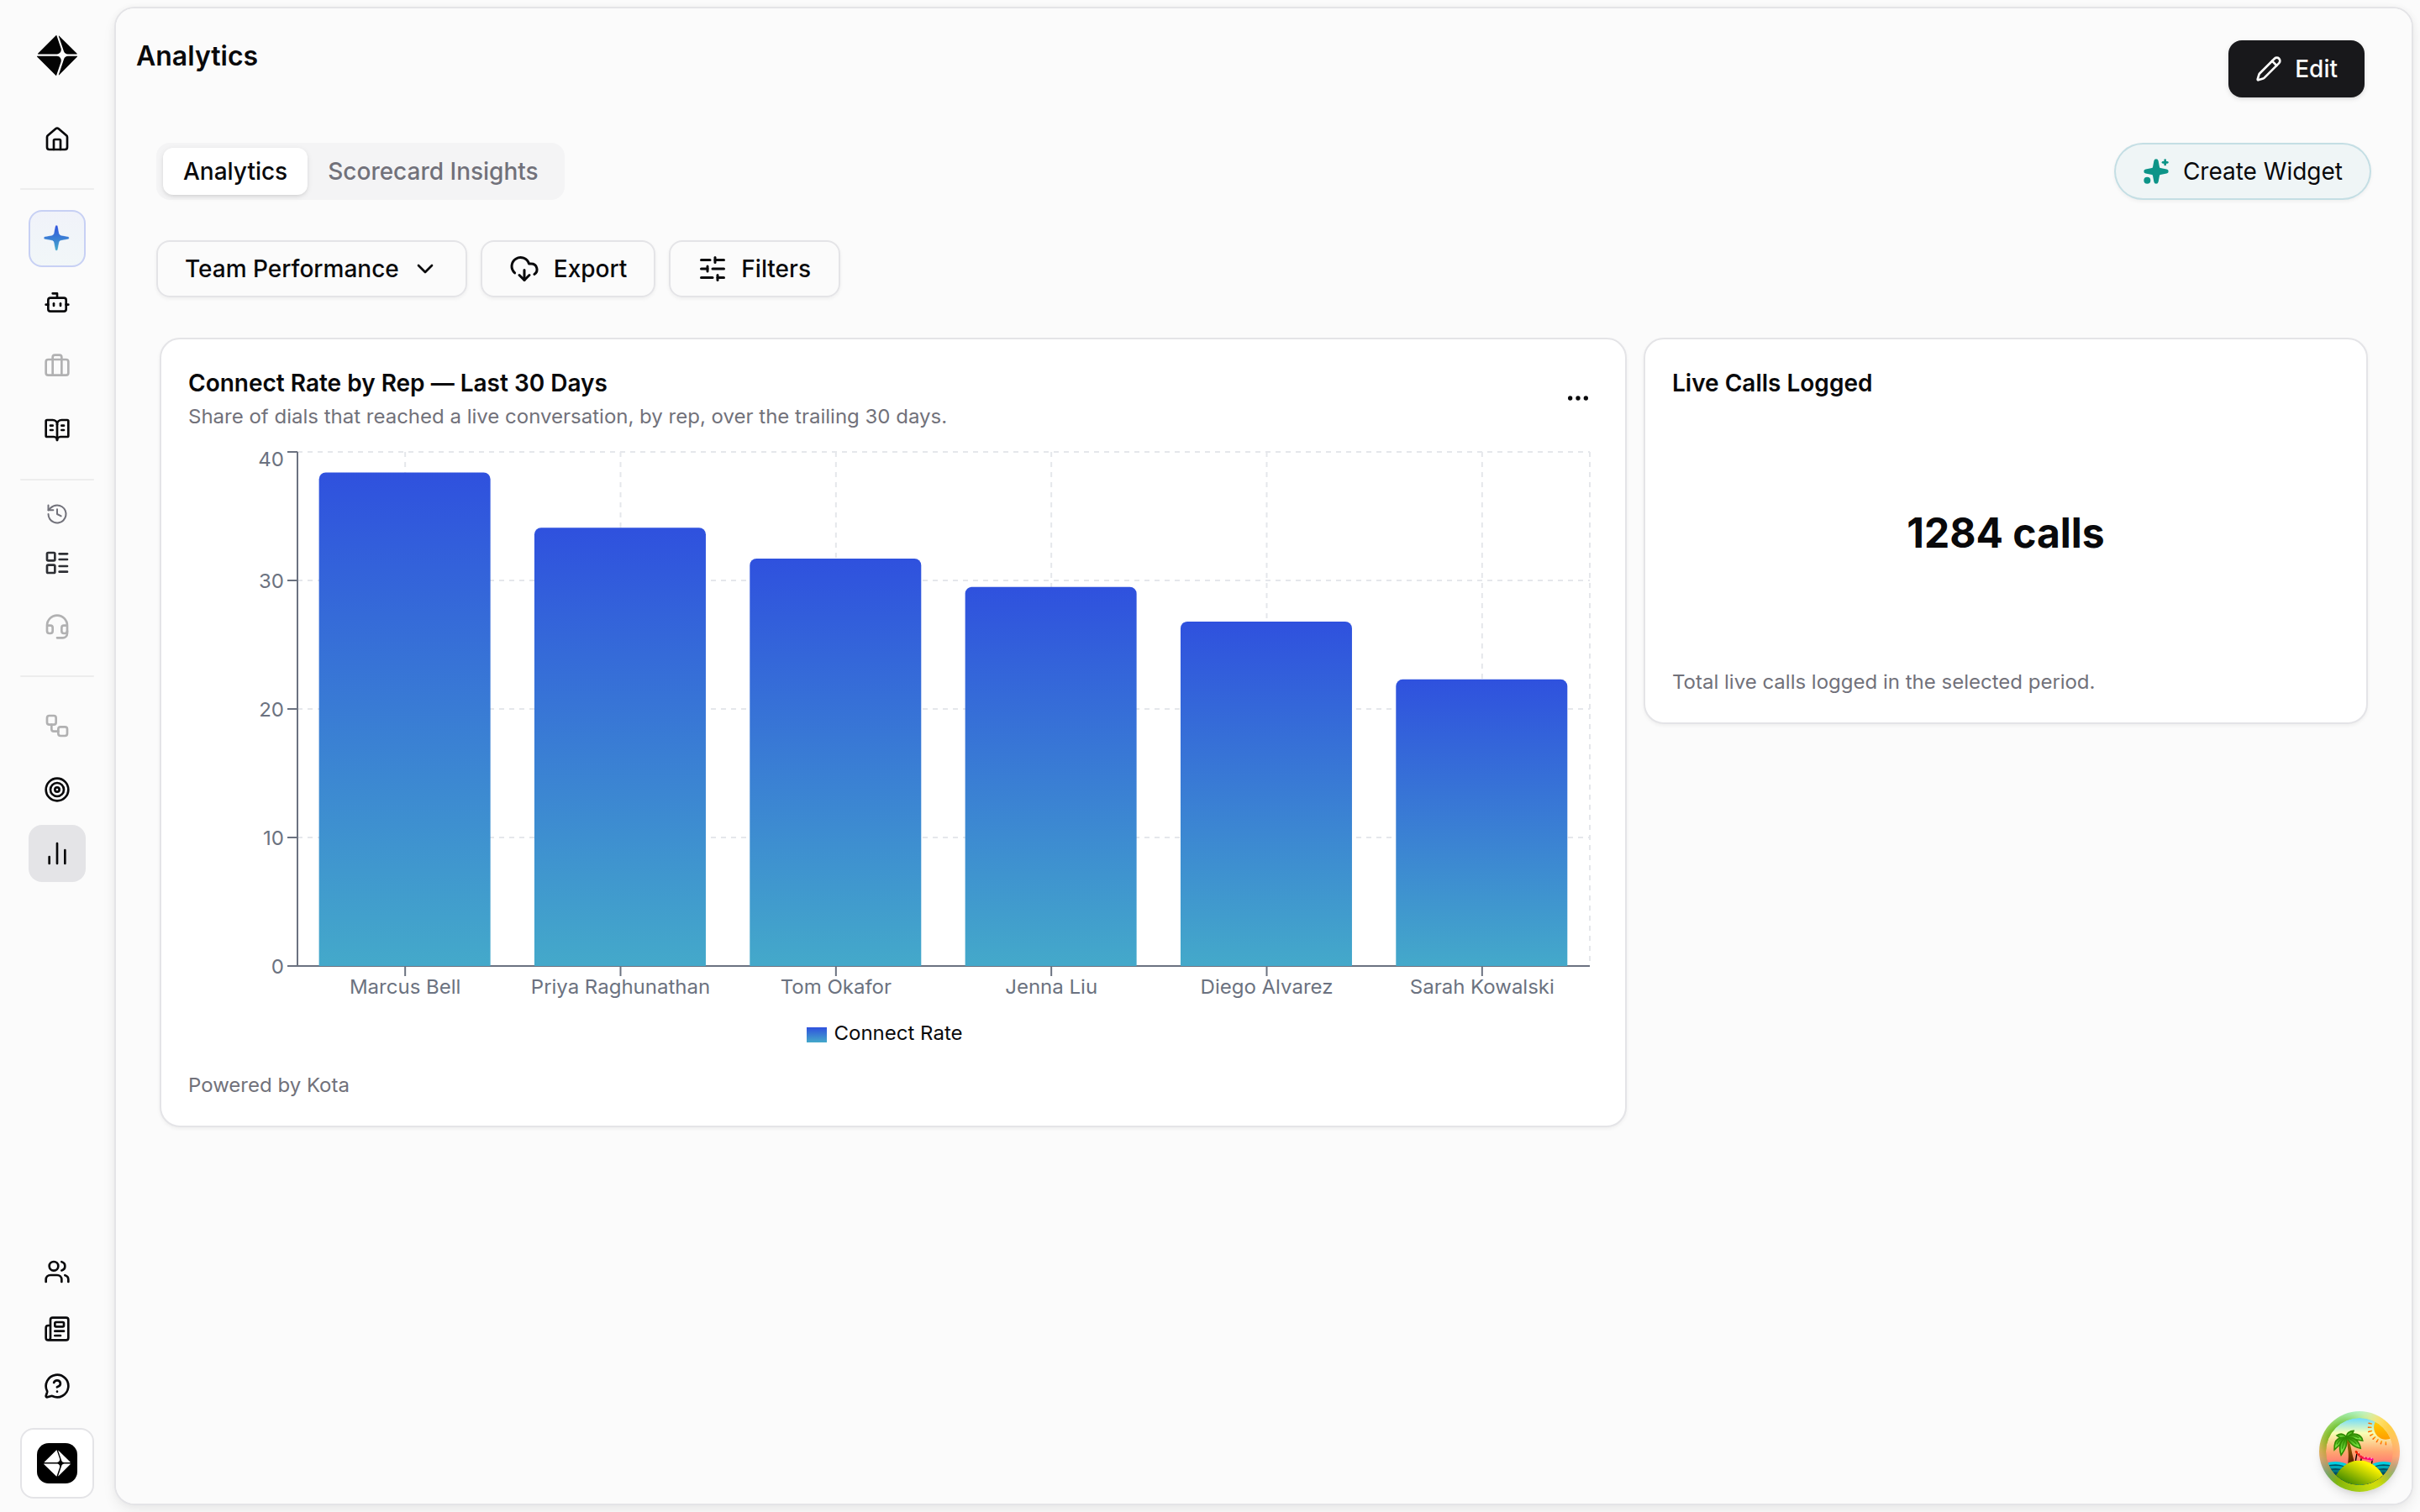
The “...” menu
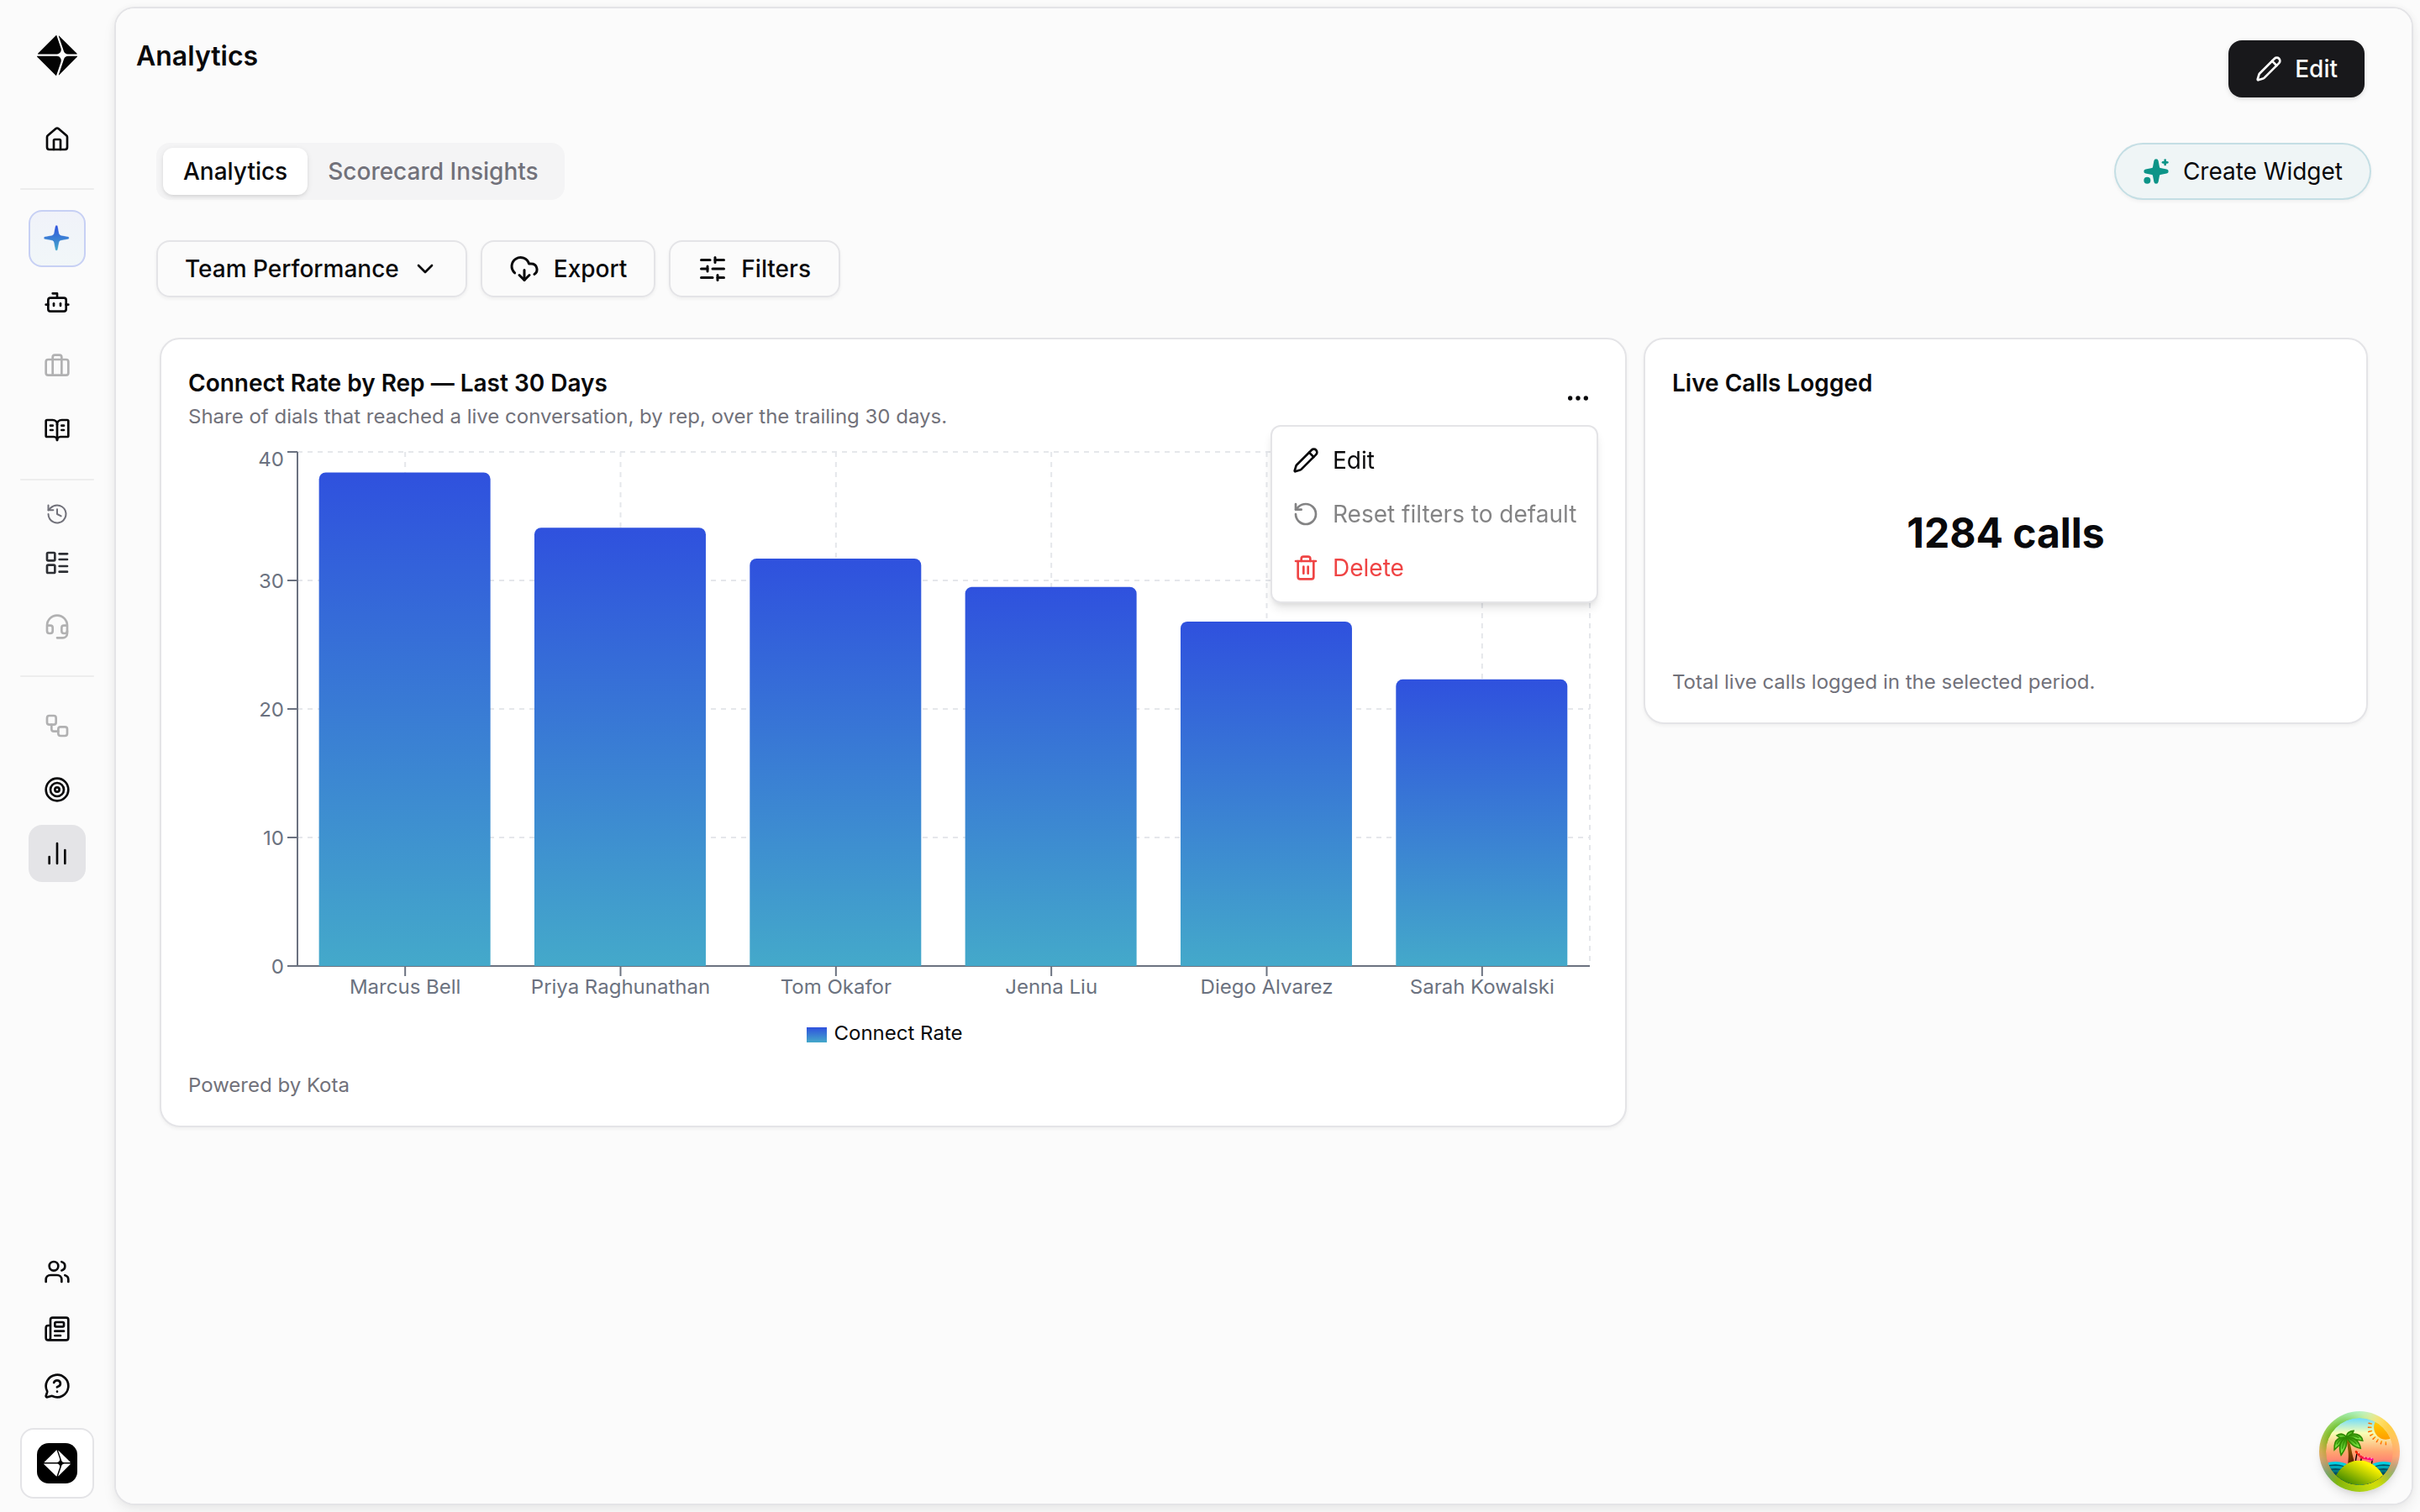
The menu on each tile has three options.
Edit — Reopens the setup form as a dialog: title, description, and which dashboards it belongs to. The save button stays unavailable until you've actually changed something. This dialog is also where you'll find Continue with Kota.
Reset filters to default — Puts the tile's filters back to how it was saved. It's greyed out unless the tile currently has filters applied, so a greyed-out item here just means there's nothing to reset.
Delete — Removes it from the dashboard.
Going back to the chat
To pick the question back up, open the tile's ... menu, choose Edit, then Continue with Kota in the dialog. That reopens the chat thread that produced the chart, so you can refine the question and update the tile from there.
How filters behave
A tile can carry filters of its own, and any date range you applied in the Kota chat comes across with it. Where a tile's own filters conflict with the dashboard's filters, the tile's filters win — so a tile pinned to “last 30 days” keeps showing 30 days even if the dashboard is set to the quarter.
What can and can't become a widget
Because the tile re-runs its question every time the dashboard loads, the question has to be one Kota can replay exactly. Concrete, filterable questions work. Judgment questions don't, because there's no exact query to run again.
Works
Objection-handling score by rep, last 30 days
Calls completed per week by team
Average scorecard result by scenario this quarter
Doesn't
Which deals are most at risk?
What's interesting here?
Anything that asks Kota to interpret rather than count
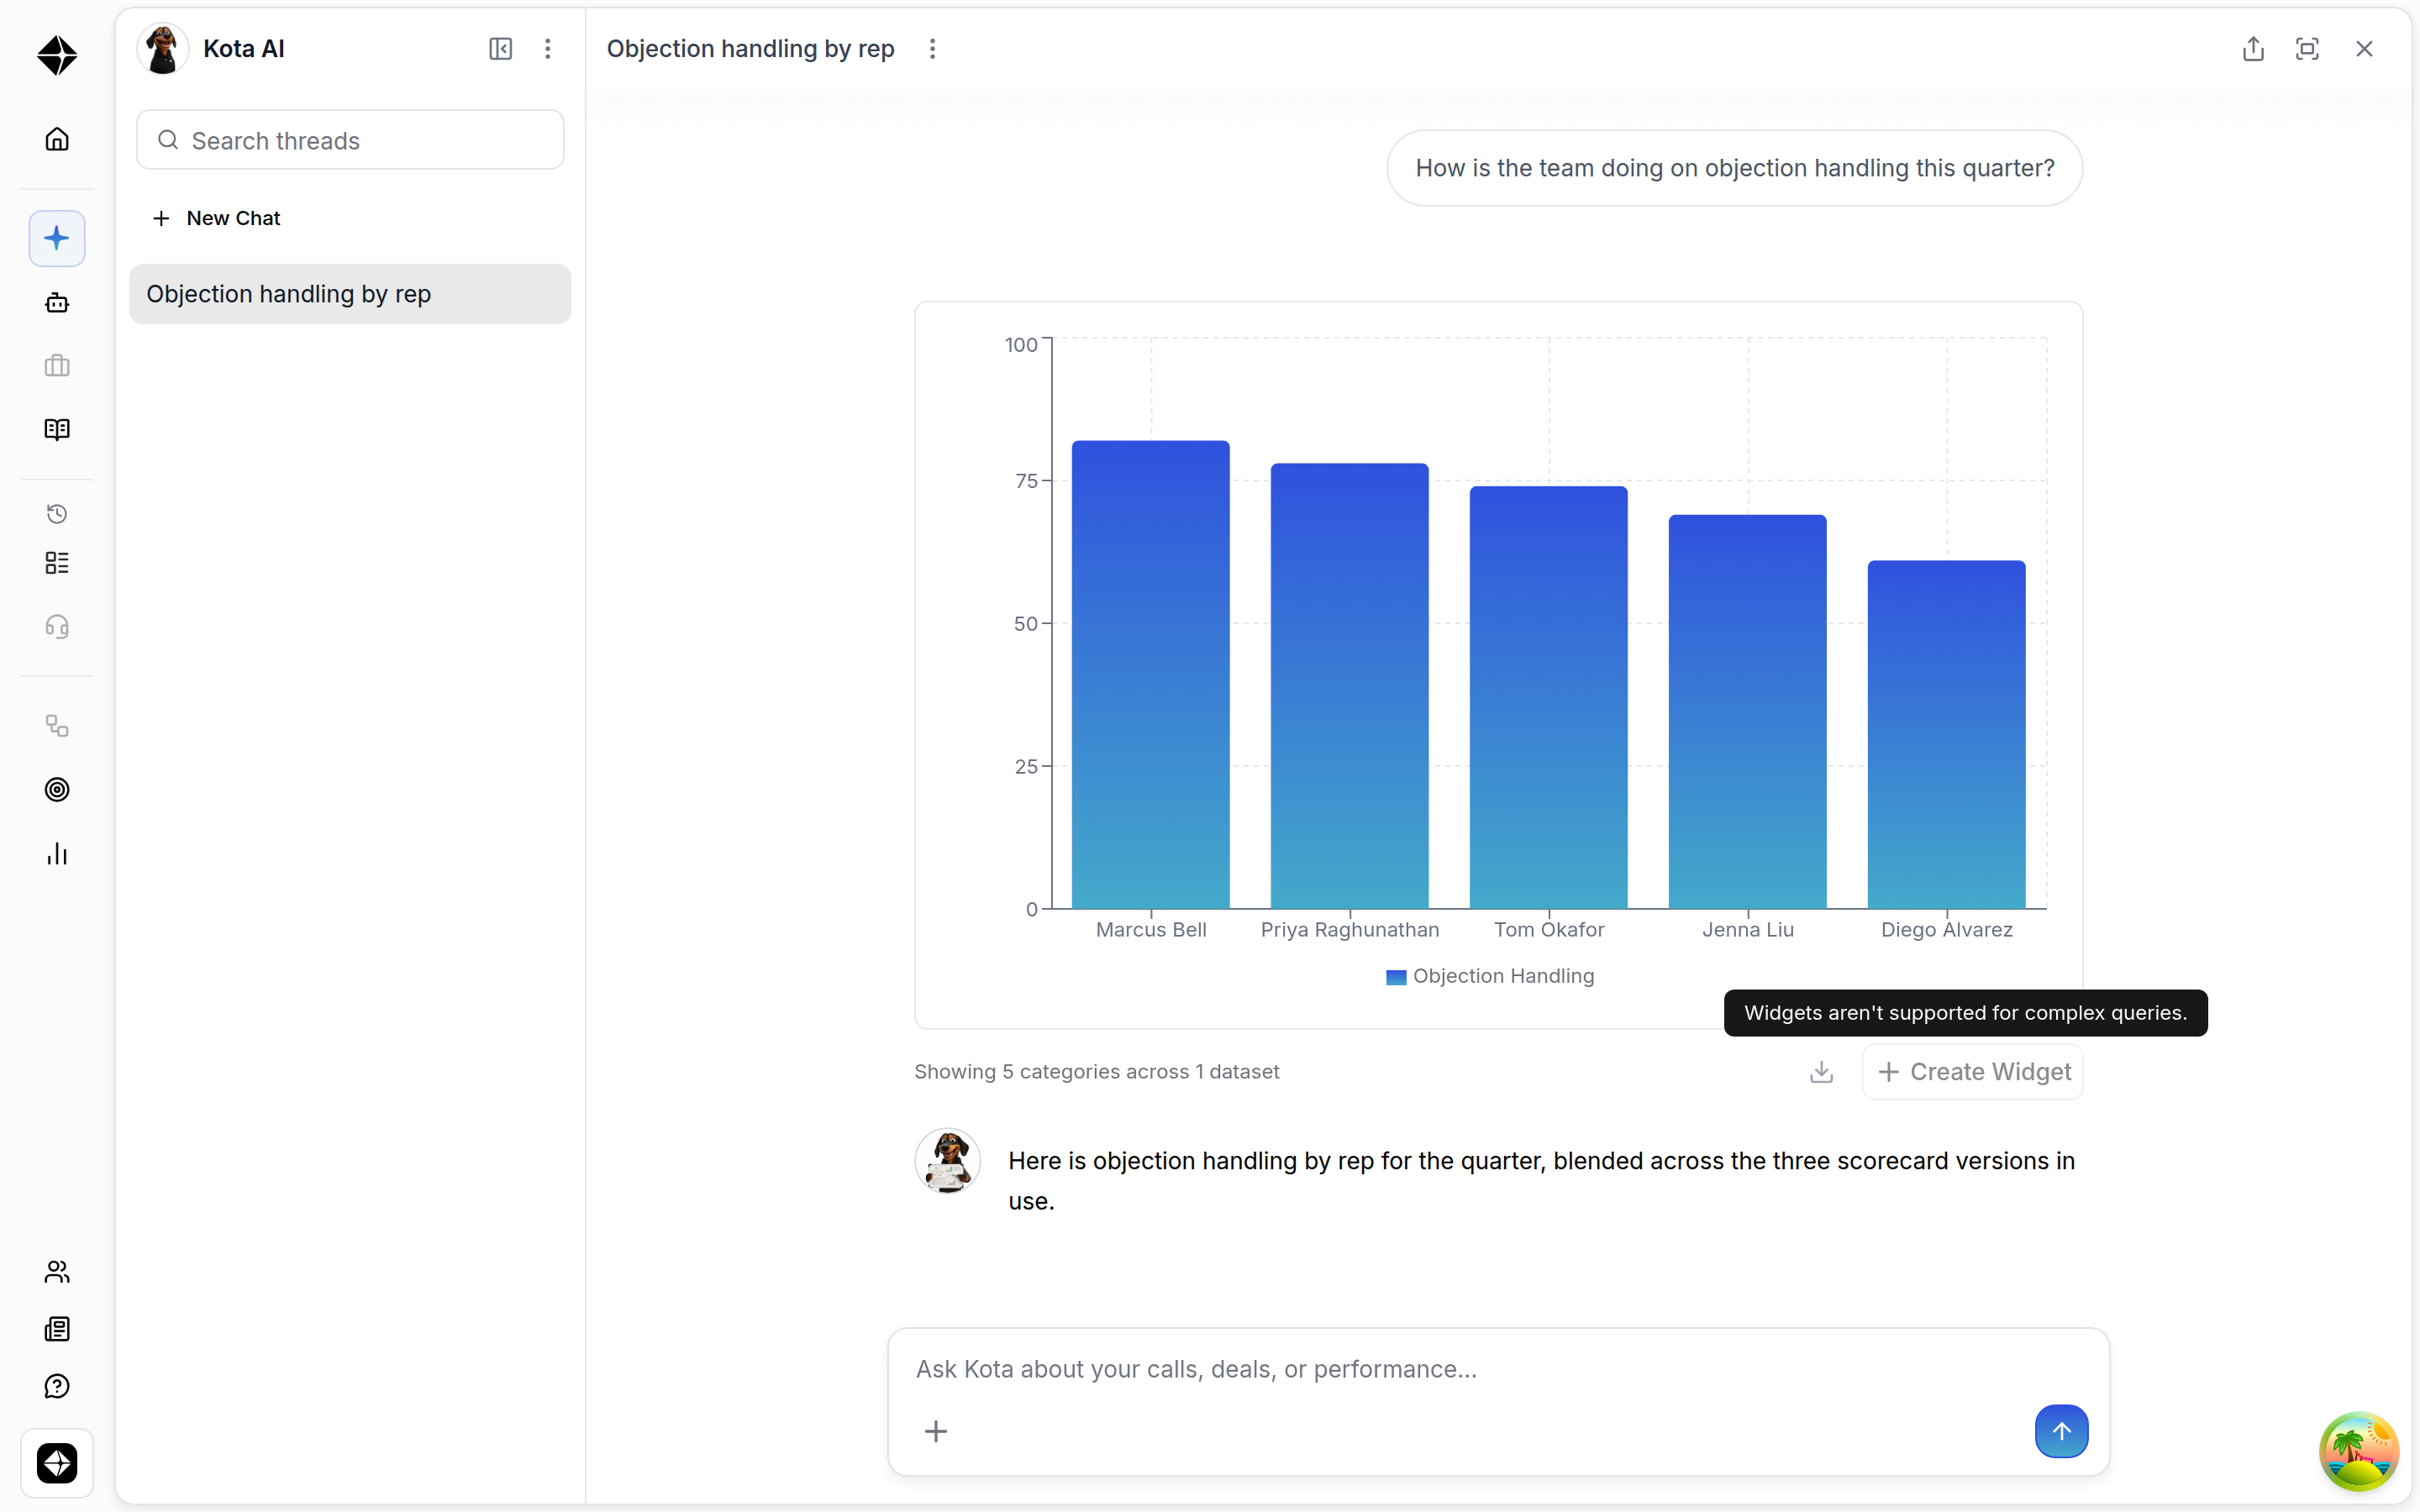
On a chart that came from a judgment question, Create Widget is greyed out with the tooltip “Widgets aren't supported for complex queries.” The fix is to ask again in concrete terms — turn “how is the team doing on objections?” into “objection-handling score by rep, last 30 days” — and save from the chart that answer produces.
Two other things worth knowing
Once you've saved a chart, that chart's button changes to Update Widget with a pencil icon and the tooltip “Update the widget you saved from this chart.” Other charts in the same thread still offer Create Widget.
If someone shares a chat thread with you read-only, you can look at the charts but can't save or update anything from it. Ask them to save it, or ask Kota the question yourself.
Troubleshooting
“Widgets aren't supported for complex queries.” The chart came from a judgment question, so there's no exact query to re-run. Rephrase as a concrete, filterable question and save from the new chart.
“Could not generate a title. Please try again.” The suggested title didn't come through. Select Generate again, or type a title yourself.
“No data available to display.” The query ran, but nothing matched. Open Edit and check the filters and date range — the period may simply be empty.
“Failed to load widget data.” The underlying data couldn't be loaded at all. Reload the dashboard, then check filters under Edit. If it persists, use Continue with Kota to re-ask the question and save again.
FAQs
Does the chart update on its own?
Yes. It re-runs its query every time the dashboard loads, so it reflects current data rather than the moment you saved it.
Can the same chart go on more than one dashboard?
Yes. Select several dashboards when you save, or add more later with Edit.
Who can see what I save?
Whoever can see the dashboard it sits on. That's set by the dashboard's permission level: shared with your organization, personal, or admins only.
Can I change it from a bar chart to a line chart?
Not in the setup form. The shape follows what Kota drew, so ask Kota to redraw the answer in chat and save from that chart instead.
Why does my tile show a different date range than the dashboard?
Because a tile's own filters take precedence over the dashboard's where the two conflict, and any date range you applied in the chat came across with it. Use Reset filters to default or Edit to change them.
What happens to the original chat?
It stays where it is. Open the tile's ... menu, choose Edit, then Continue with Kota to reopen that thread.